Please Sign In to contact this author.
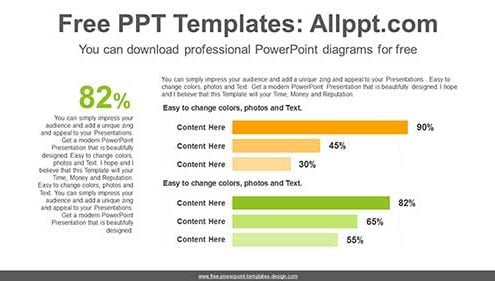
This diagram is a bar chart that compares two types. These bar charts help you visualize comparisons, such as two variations, growth rates. You can also modify data with simple…